
ML Coursera 9 - w9: Anomaly Detection & Recommender Systems
Posted on 03/11/2018, in Machine Learning.This note was first taken when I learnt the machine learning course on Coursera.
Lectures in this week: Lecture 15, Lecture 16.
error This note of Alex Holehouse is also very useful (need to be used alongside with my note).
Density Estimation
Problem motivation
- Check if there is an anomalous data-point in the data?
- How we do this?
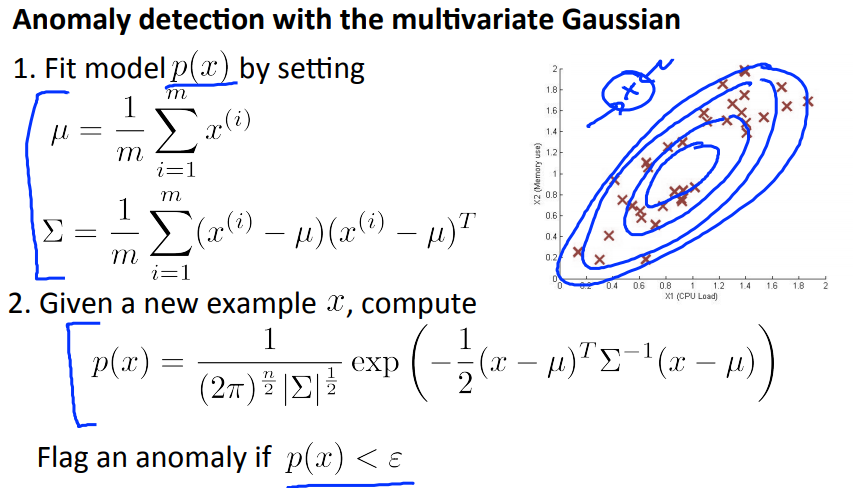
- Using our training dataset we build a model with $p(x)$ “What is the probability that example x is normal?”
- If $p(x_{test}) < \epsilon$: flag this as an anomaly
- If $p(x_{test}) \ge \epsilon$: flag this as OK.
- $\epsilon$ is some threshold probability value which we define, depending on how sure we need/want to be
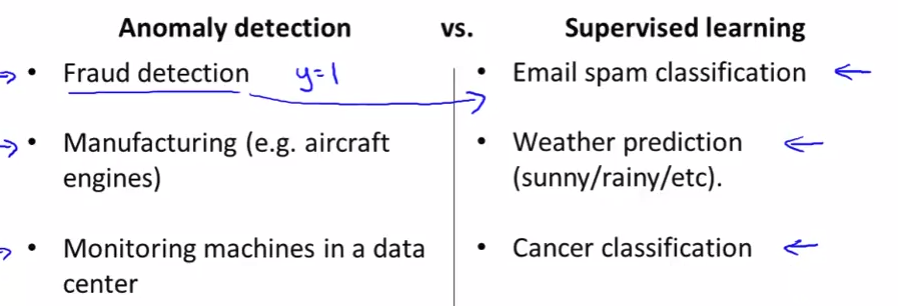
- Application: Fraud detection, Manufacturing (aircraft engine), Monitoring computers in data center,…
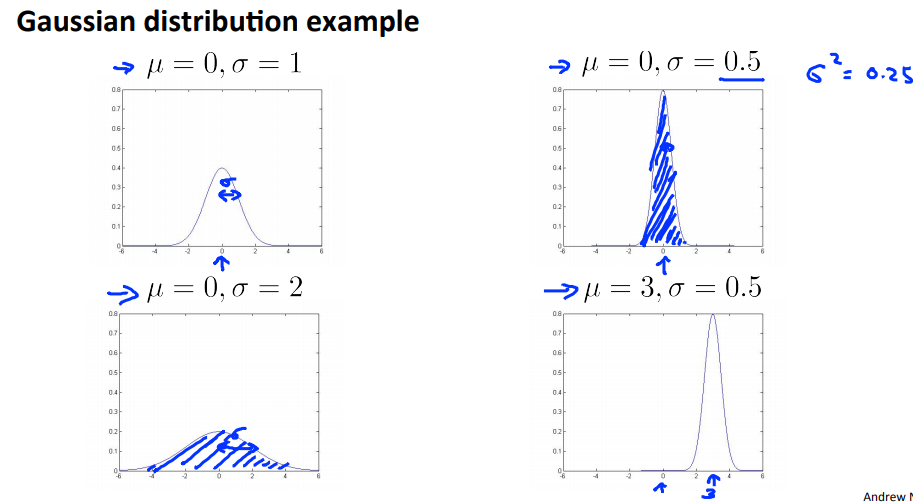
Gaussian distribution (normal distribution)
- $\mu$: mean, average of examples.
- $\sigma^2$: standard deviation squared.
- We can take $m-1$ instead of $m$ for $\sigma^2$. Slightly different mathematical problems, but in practice it makes little difference.
Algorithm
- Note of Househole
-
Given training set $x^{(i)}\in \mathbb{R}^n$ for $i=1,…,m$.
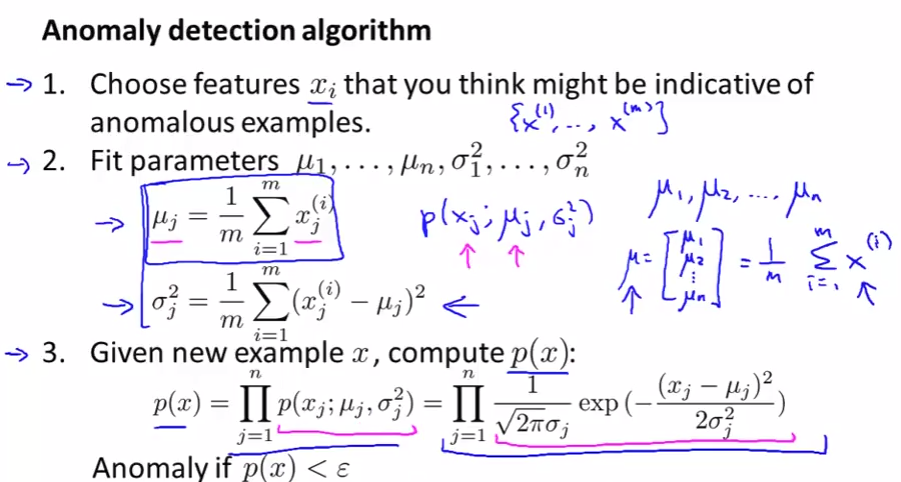
- $x_j$ feature! for $j=1,…,n$.
- At each feature, there is m example $x_j^{(i)}$ for $i=1,…,m$. From these m examples, we can find (for each feature $x_j$) a couple $\mu_j, \sigma_j^2$.
-
Given a test $x^{(test)}_{j}$, we can compute
- The importance is the choice of $\epsilon$.
Building an Anomaly Detection System
Developing and Evaluating an Anomaly Dection System
- Note of Househole
- To develop an anomaly detection system quickly, would be helpful to have a way to evaluate your algorithm
- Sometimes, people use the same data set for Cross Validation set and Test but this is not a good practice and less recommended.
- So far we’ve been treating anomalous detection with unlabeled data. If you have labeled data allows evaluation: if you think something iss anomalous you can be sure if it is or not.
- If you have CV set you can see how varying $\epsilon$ effects various evaluation metrics. Then pick the value of epsilon which maximizes the score on your CV set
- Evaluate algorithm using cross validation
- Do final algorithm evaluation on the test set
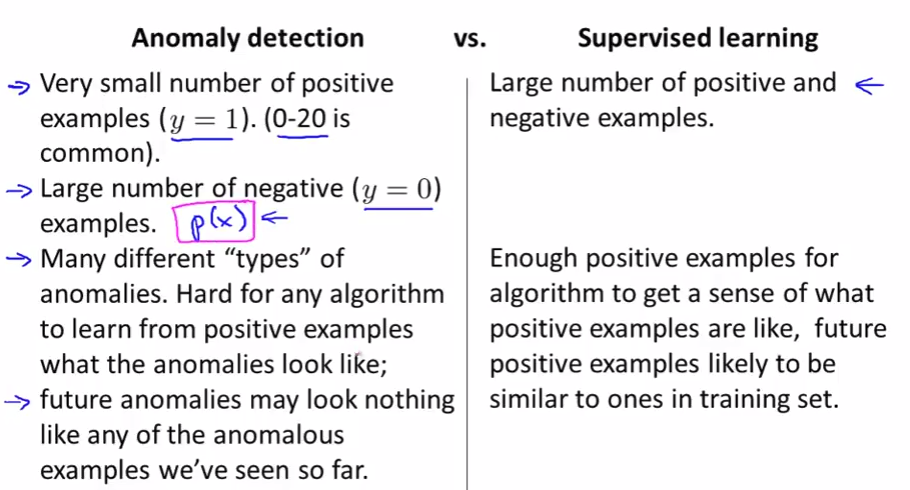
Anomaly Detection vs Supervised Learning
- If we have labeled data, why we not use a supervised learning algorithm?
- When to use anomaly, when to use supervised?
Choosing what features to use
-
If our data after plot (
hist) doesn’t look like Gaussian shape, we can “make” it again by change the feature a little bit.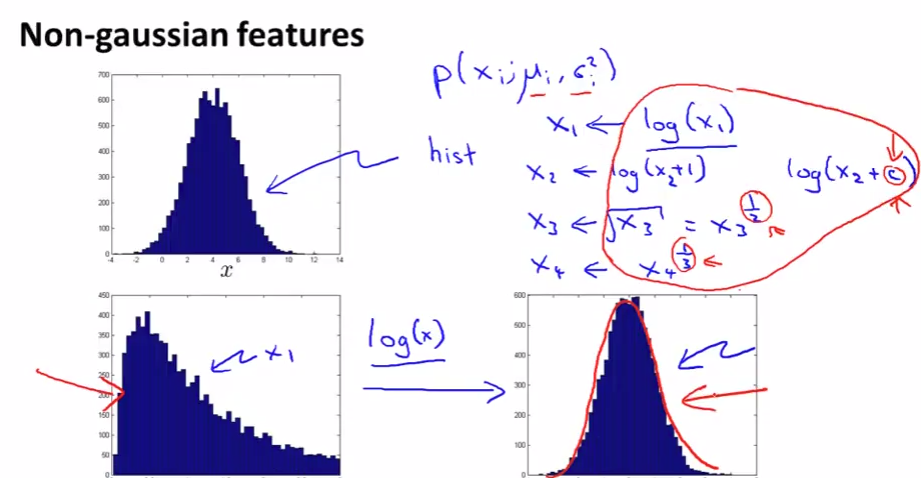
-
Suppose your anomaly detection algorithm is performing poorly and outputs a large value of p(x) for many normal examples and for many anomalous examples in your cross validation dataset. Which of the following changes to your algorithm is most likely to help?
- Try coming up with more features to distinguish between the normal and the anomalous examples.
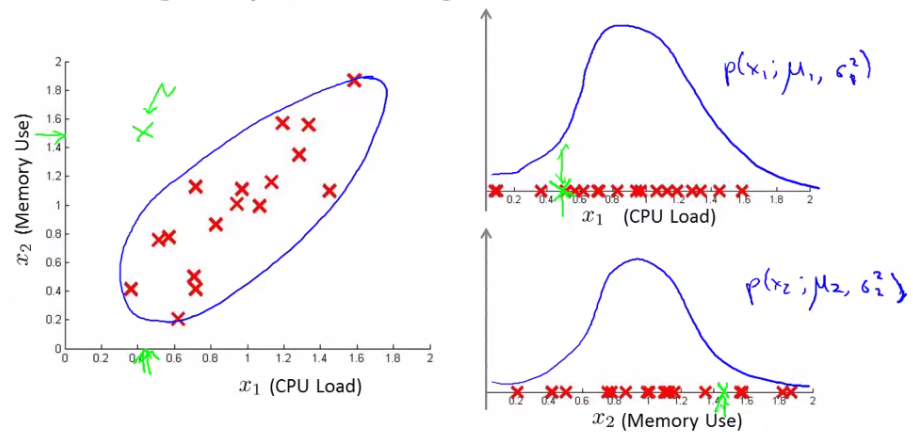
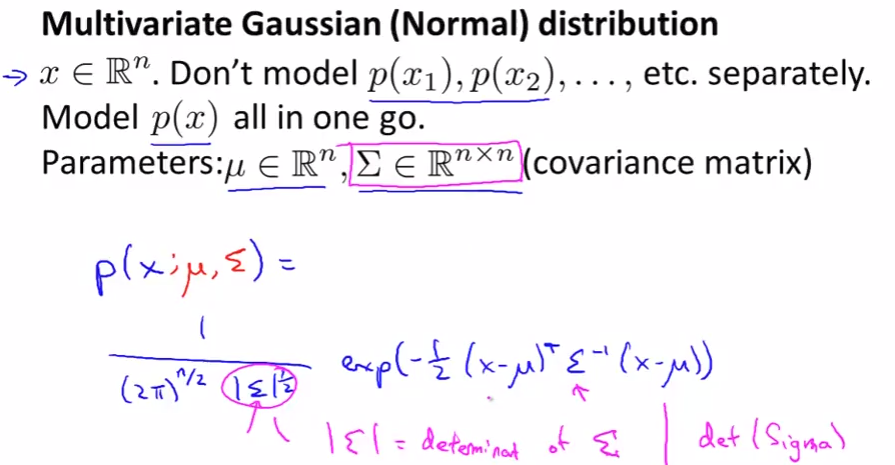
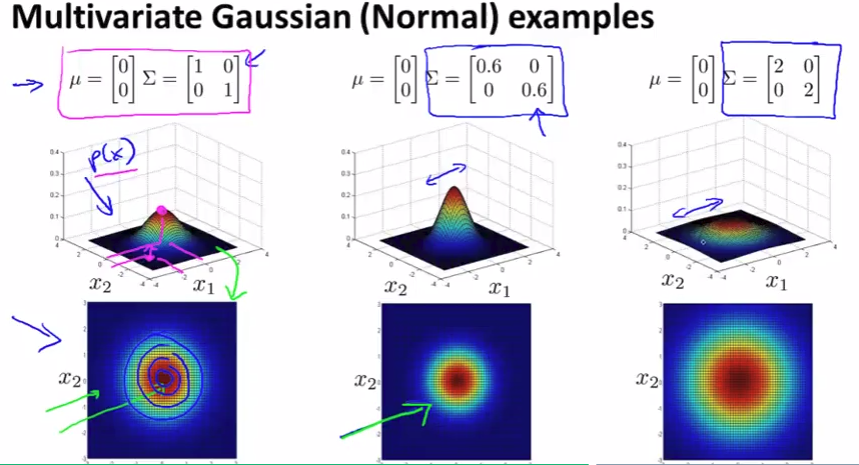
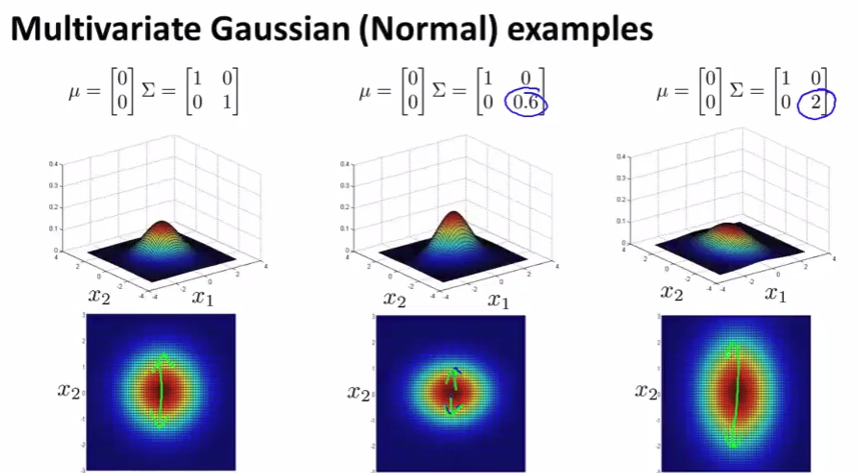
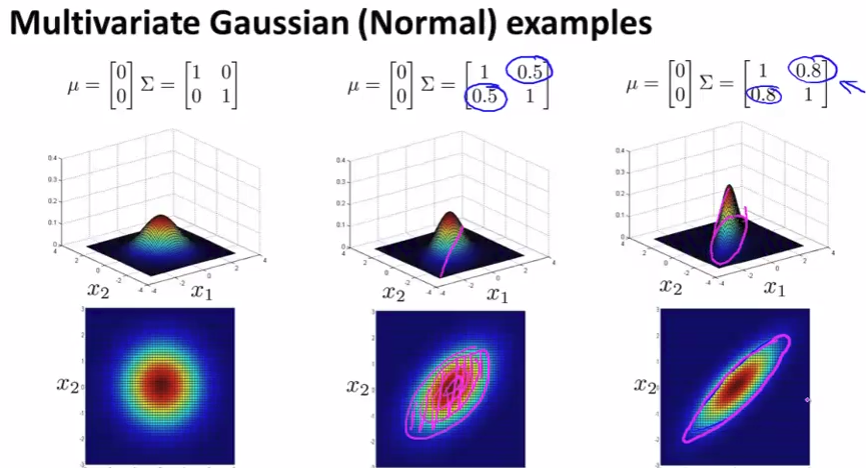
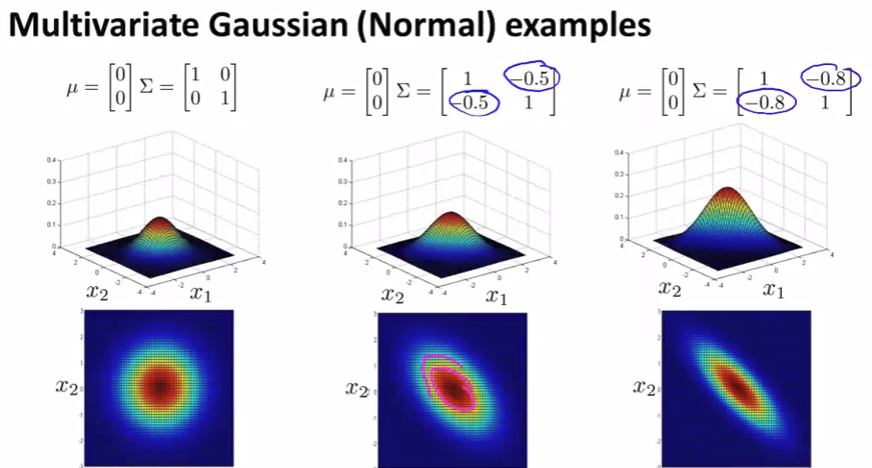
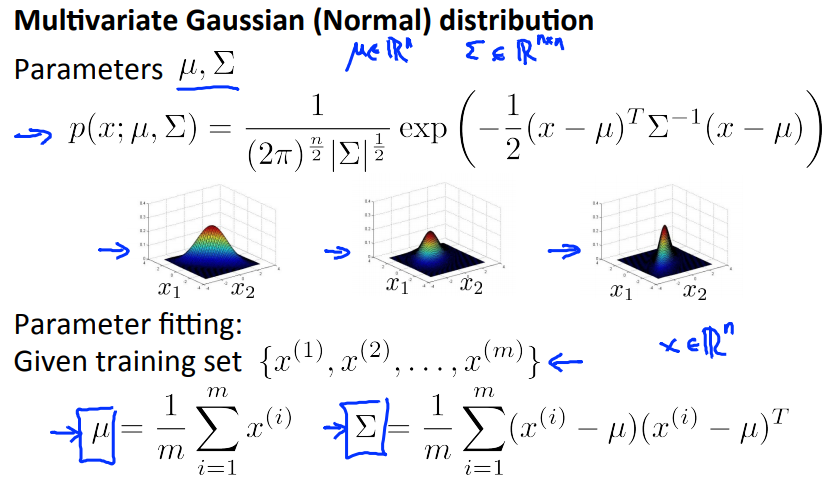
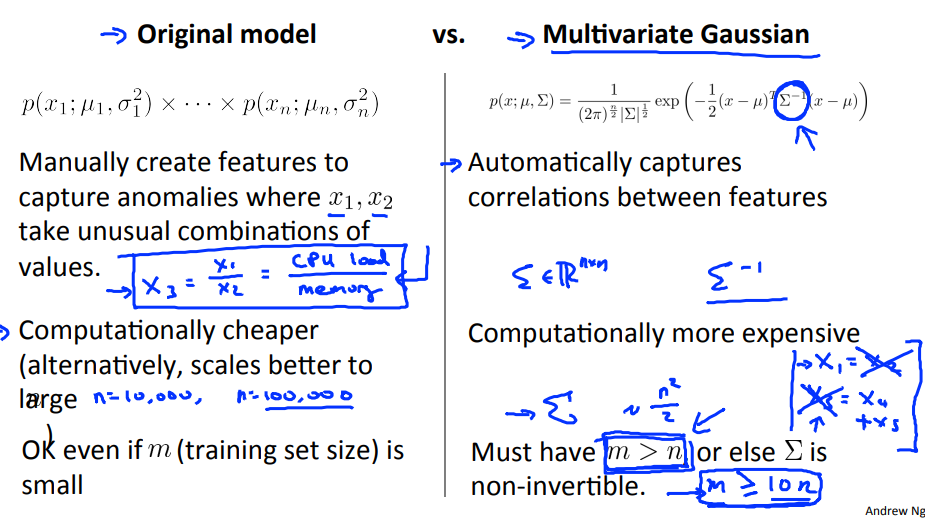
Multivariate Gaussian distribution
Multivariate Gaussian distribution
Problem: in each single gaussian, it’s good with high probability but actually not!
Anomaly Detection using the Multivariate Gaussian distribution
(check Househole’s note for more details)
Predicting movie ratings
- Check Househole’s note.
- Recommender Systems: important application of ML.
- In academy, it has less attension but in industry, it costs!
- There is not so much a technique, it’s a big idea.
- Recommender systems do this - try and identify the crucial and relevant features
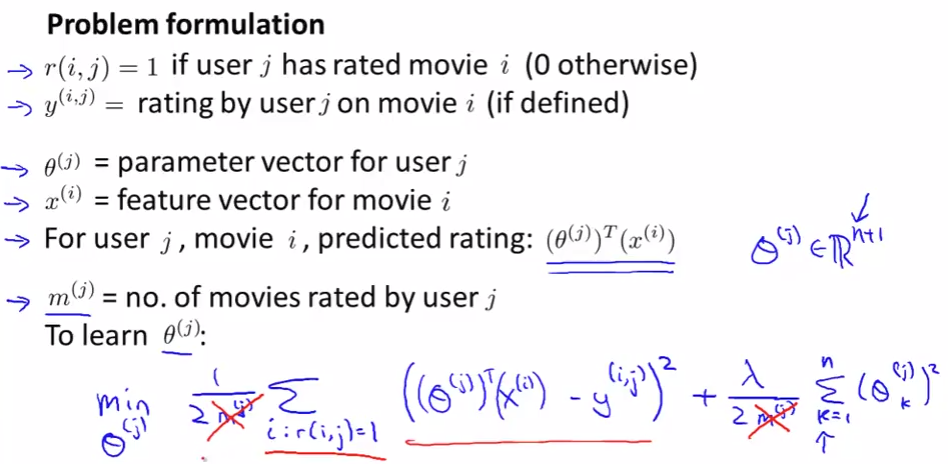
Problem formulation
There are some movies that some users haven’t seen yet. Based on what they have already seen or others did, we can predict their rate for movies that they haven’t watched. From these prediction, we can recommend the movies they like (if the predicted rating is high).
Content based recommendations
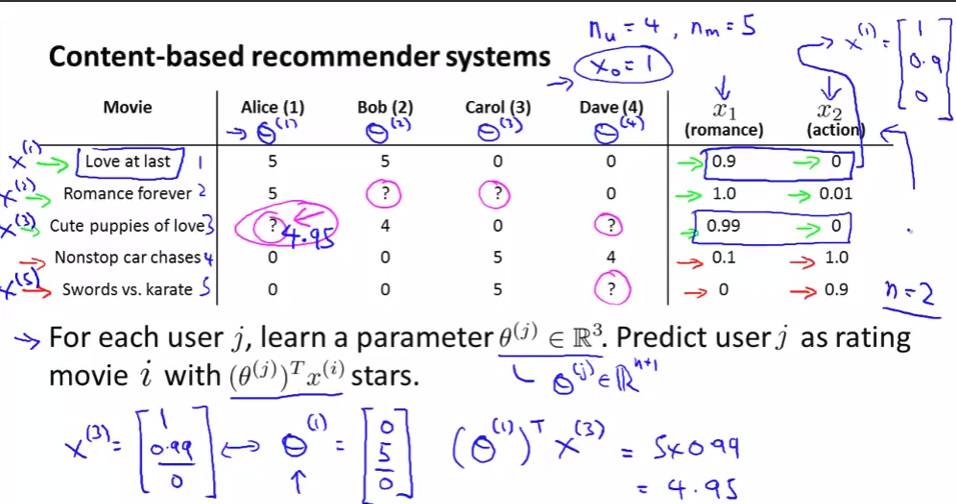
- This approach is called content-based approach because we assume we have features regarding the content which will help us identify things that make them appealing to a user.
- However, often such features are not available - next we discuss a non-contents based approach!
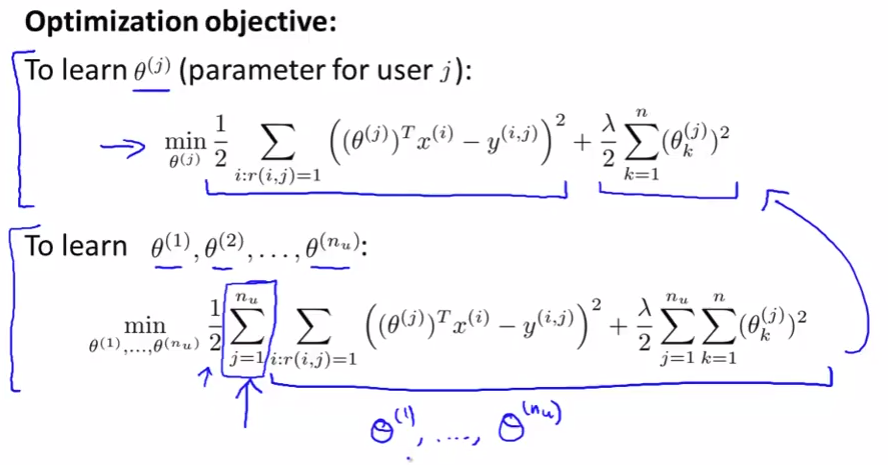
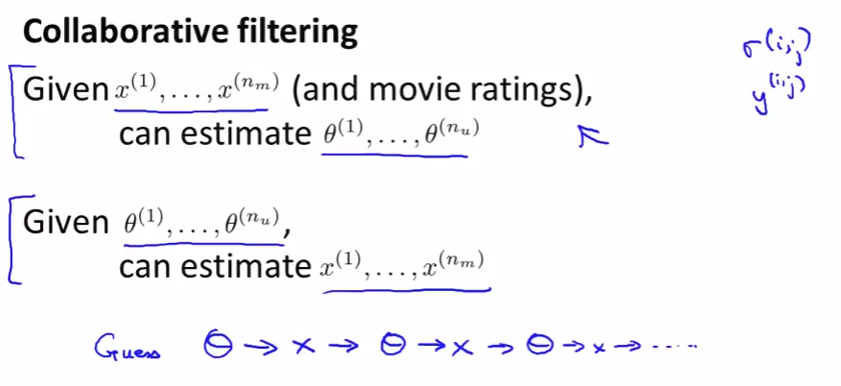
Collaborative filtering
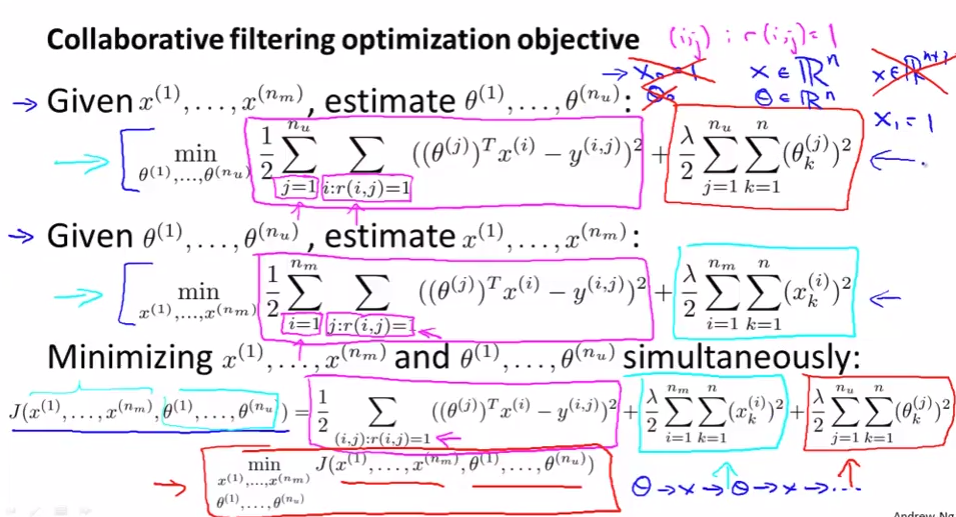
Collaborative filtering
- It can learn for itself what features it needs to learn.
- The values of $\Theta$ show the “idea” of the user. For example, Alice says that she really like the romantic movie and she doesn’t like action movies, i.e. $\Theta = [0 5 0]$.
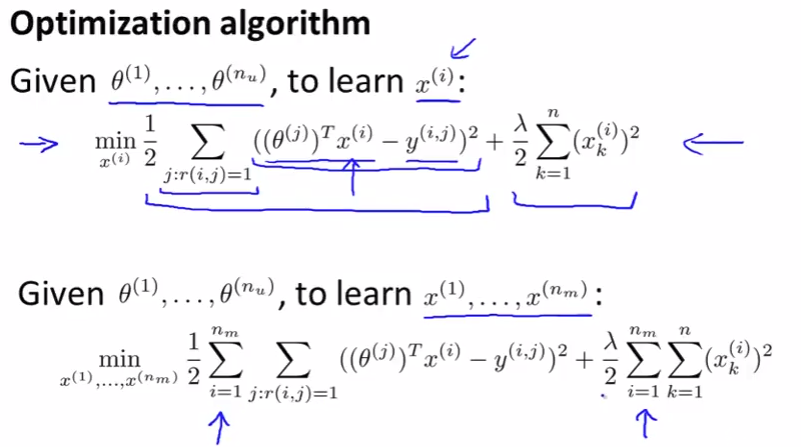
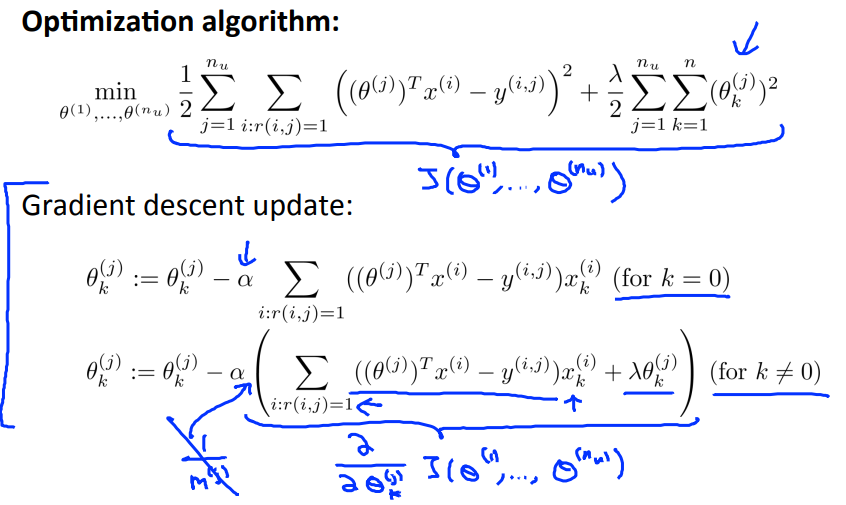
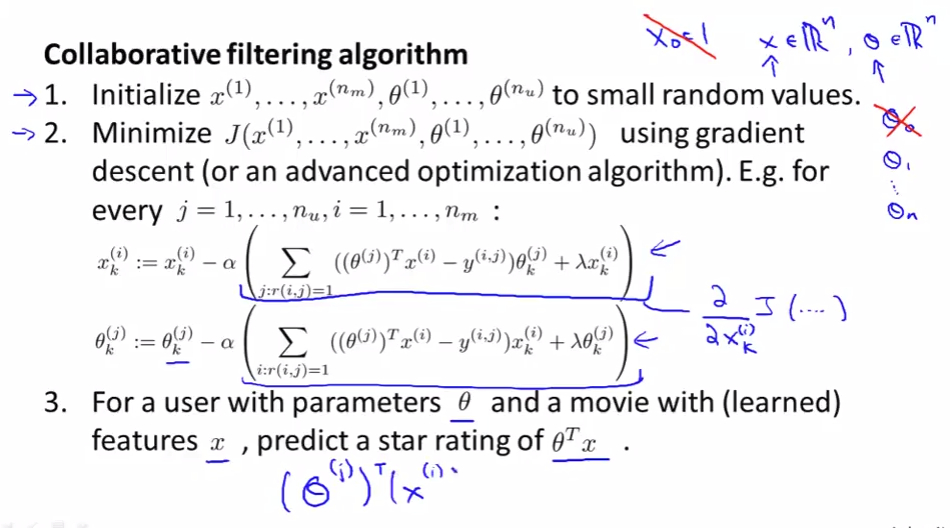
Collaborative filtering algorithm
Low rank matrix factorization
Vectorization: low rank matrix factorization
- Having looked at collaborative filtering algorithm, how can we improve this? Given one product, can we determine other relevant products?
![]()
![]()
Implementational detail: mean normalization
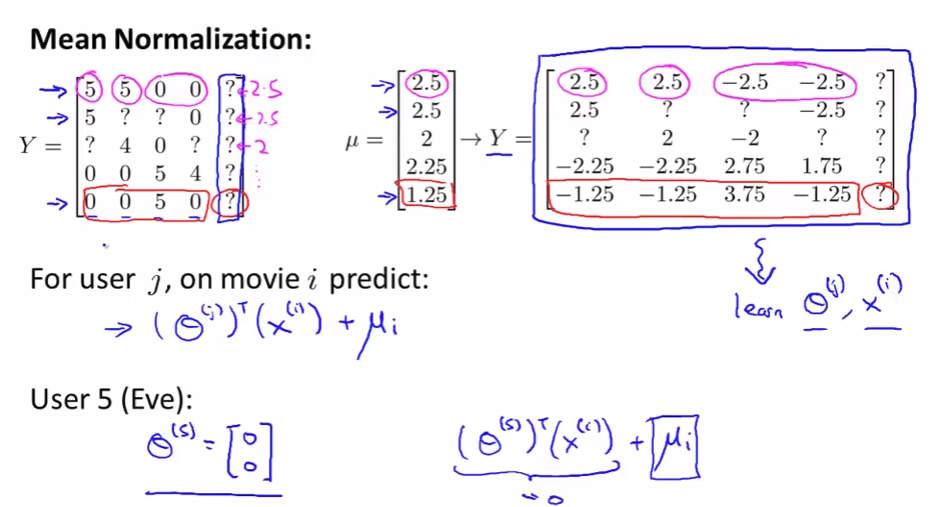
- We don’t scale the value because all movies have alreay been scale by rates.