
IBM Data Course 7: Data Visualization with Python
Posted on 14/04/2019, in Data Science, Python.This note was first taken when I learnt the IBM Data Professional Certificate course on Coursera.
settings_backup_restore
Go back to Course 6.
keyboard_arrow_right
Go to Course 8.
Week 1: Introduction to Data Visualization Tools
error The lab didn’t work!!! Problem with file xls, it is not shared!
- Tools: matplotlib, seaborn, folium.
- Dataset: immigration to Canada from 1980 to 2013.
- pandas is a python library for data manipulation and analysis.
Introduction to Data Visualization
- Why build visuals?
- For exploratory data analysis
- Communicate data clearly
- Share unbiased representation of data
- USe them to support recommendations to different stakeholders
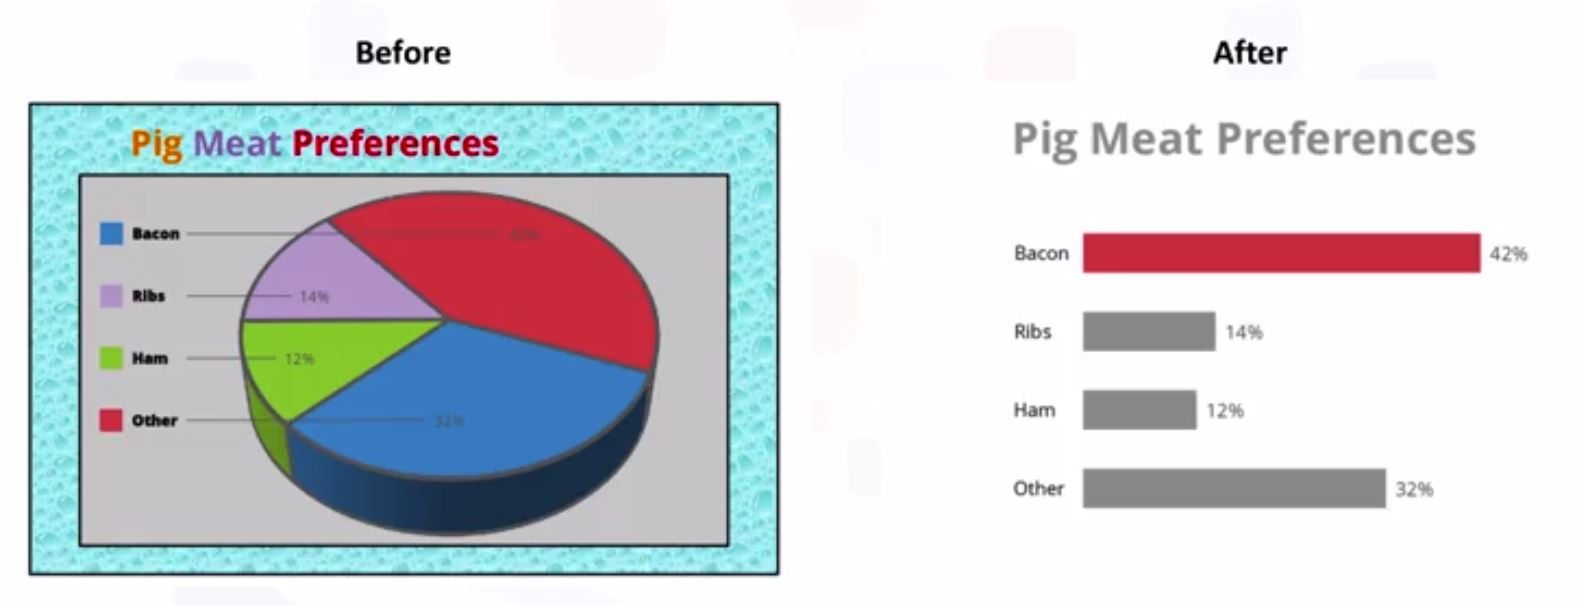
- Remember: Less is more attractive / effective / impactive!
- Remove everything that can be distracting from the main message.
- Remove border
- Remove background
- Don’t use 3D, just 2D
- Using different color (make the main one be diff from the others)
- Checkout DarkHorseAnalytics for more techniques how to clean and make clear data.
Matplotlib
- Matplotlib Architecture has 3 layers (check more)
- Scripting layer (pyplot)
- Artist layer (Artist)
- Backend layer (FigureCanvas, Renderer, Event)
- Create 1000 random numbers using numpy:
np.random.randn(1000) - Check the lab for more.
Line plots
- The best use case for a line plot is when you have a continuous dataset and you’re interested in visualizing the data over a period of time.
Week 2: Basic and Specialized Visualization Tools
error The lab didn’t work!!! Problem with file xls, it is not shared!
- Area plot (area chart or area graph), based on line plot
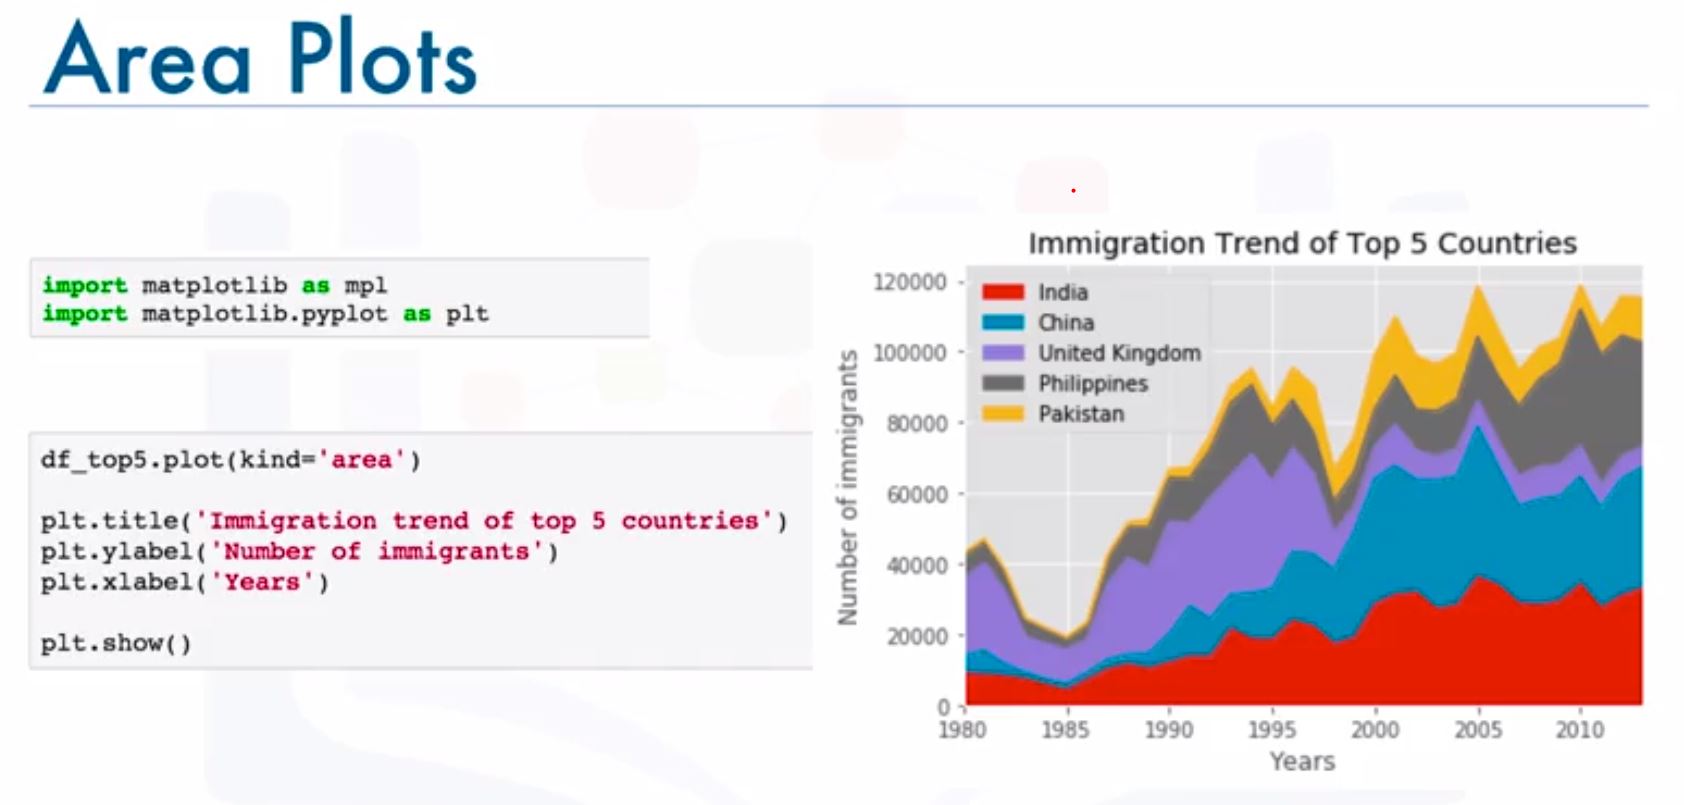
import matplotlib as mpl import matplotlib.pyplot as plt df.plot(kine="area") plt.show() - Histogram: A histogram is a way of representing the frequency distribution of a numeric dataset. Using bins.
df.plot(kind="hist")- bin’s edges are aligned to the horizontal axis
  count, bin_edges = np.histogram(df['2013'])
  df['2013'].plot(kind='hist', xticks = bin_edges)
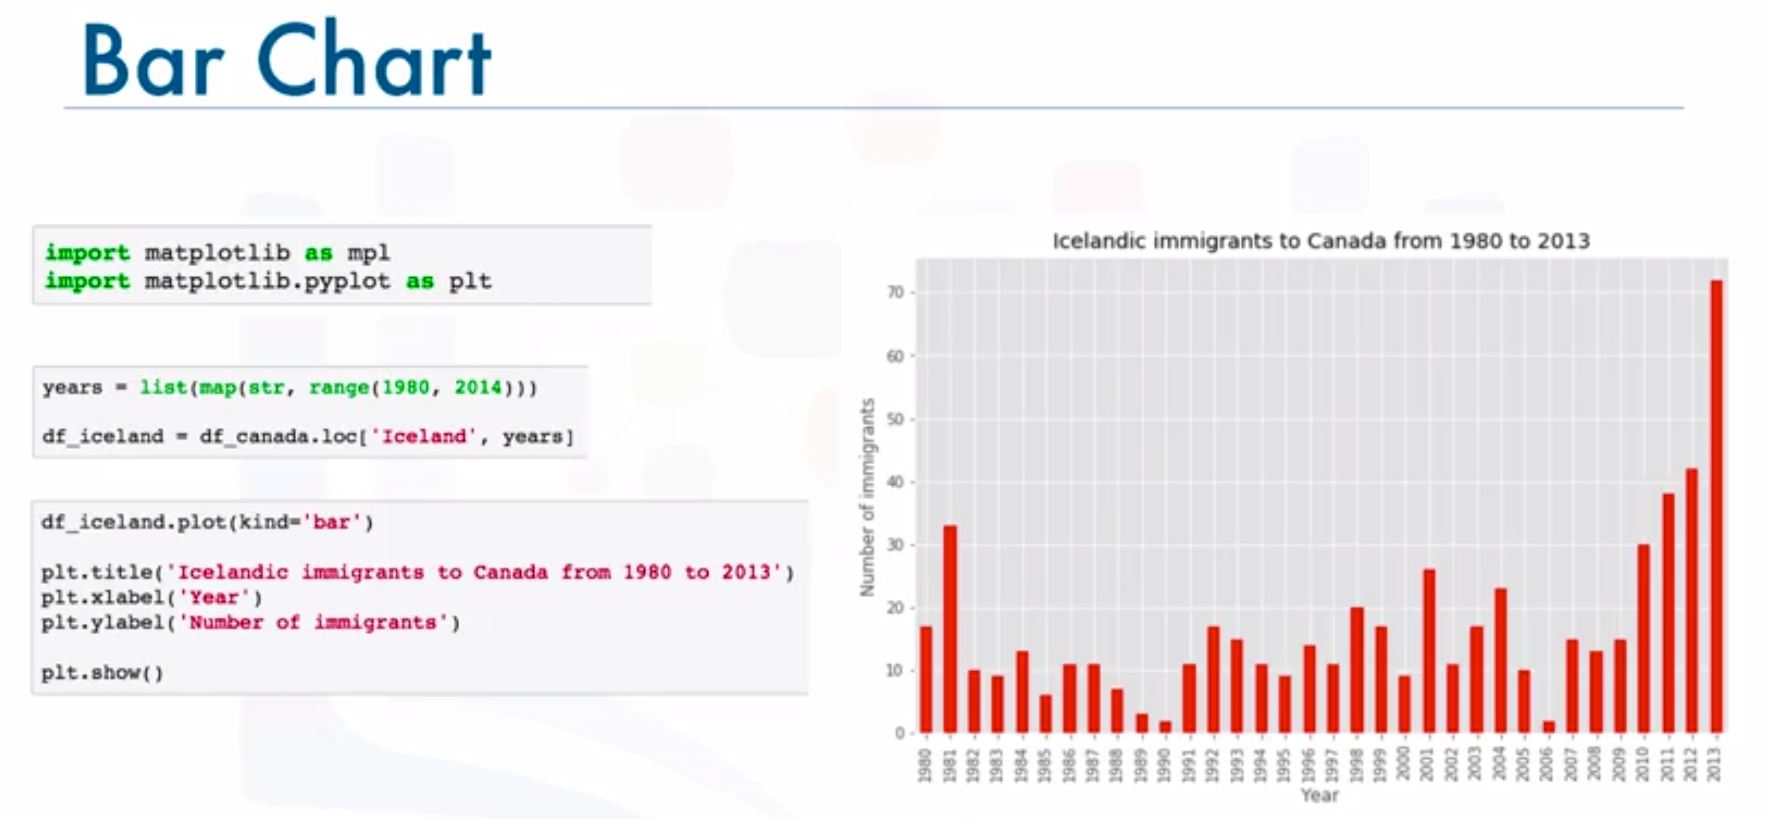
- Bar charts: It is commonly used to compare the values of a variable at a given point in time.
- Pie chart: A pie chart is a circular statistical graphic divided into slices to illustrate numerical proportion.
- Box plot:
Week 3: Advanced Visualizations and Geospatial Data
error A part of the lab didn’t work!!! Problem with file xls, it is not shared! You can check the other part that works here.
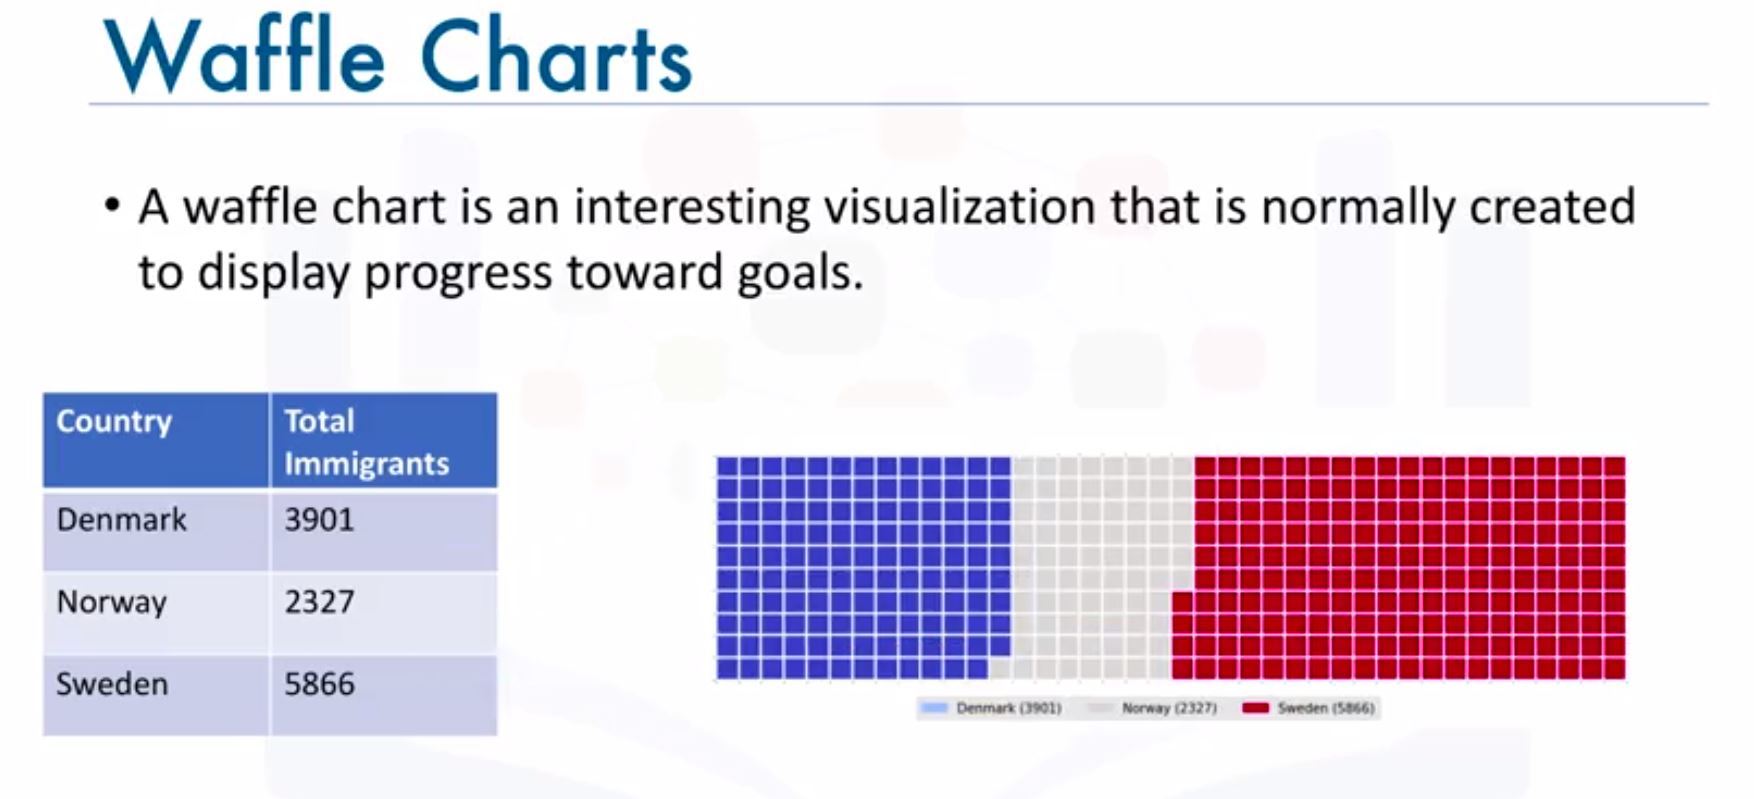
- Waffle Charts: A waffle chart is a great way to visualize data in relation to a whole or to highlight progress against a given threshold. matplotlib doesn’t have a built-in function to build waffle chat.
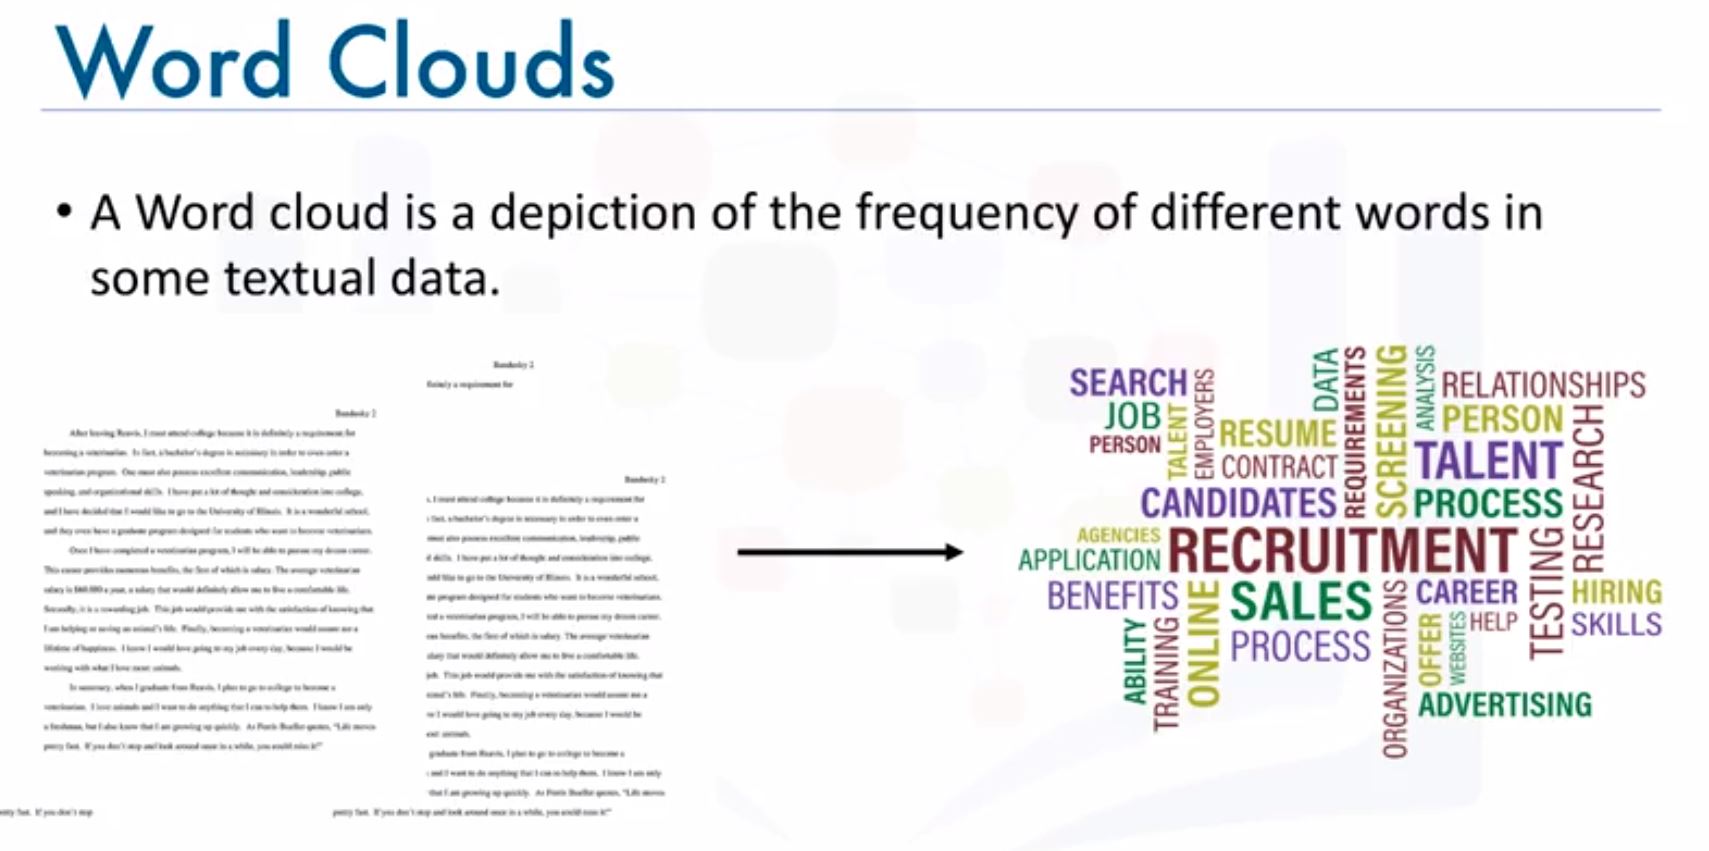
- Word cloud: A word cloud is simply a depiction of the importance of different words in the body of text. matplotlib doesn’t have a built-in function to build word cloud. There is another library.
- Seaborn and regression plots: It was built primarily to provide a high-level interface for drawing attractive statistical graphics, such as regression plots, box plots, and so on. Seaborn makes creating plots very efficient. Therefore with Seaborn you can generate plots with code that is 5 times less than with Matplotlib.
- Folium: Folium is a powerful data visualization library in Python that was built primarily to help people visualize geospatial data.
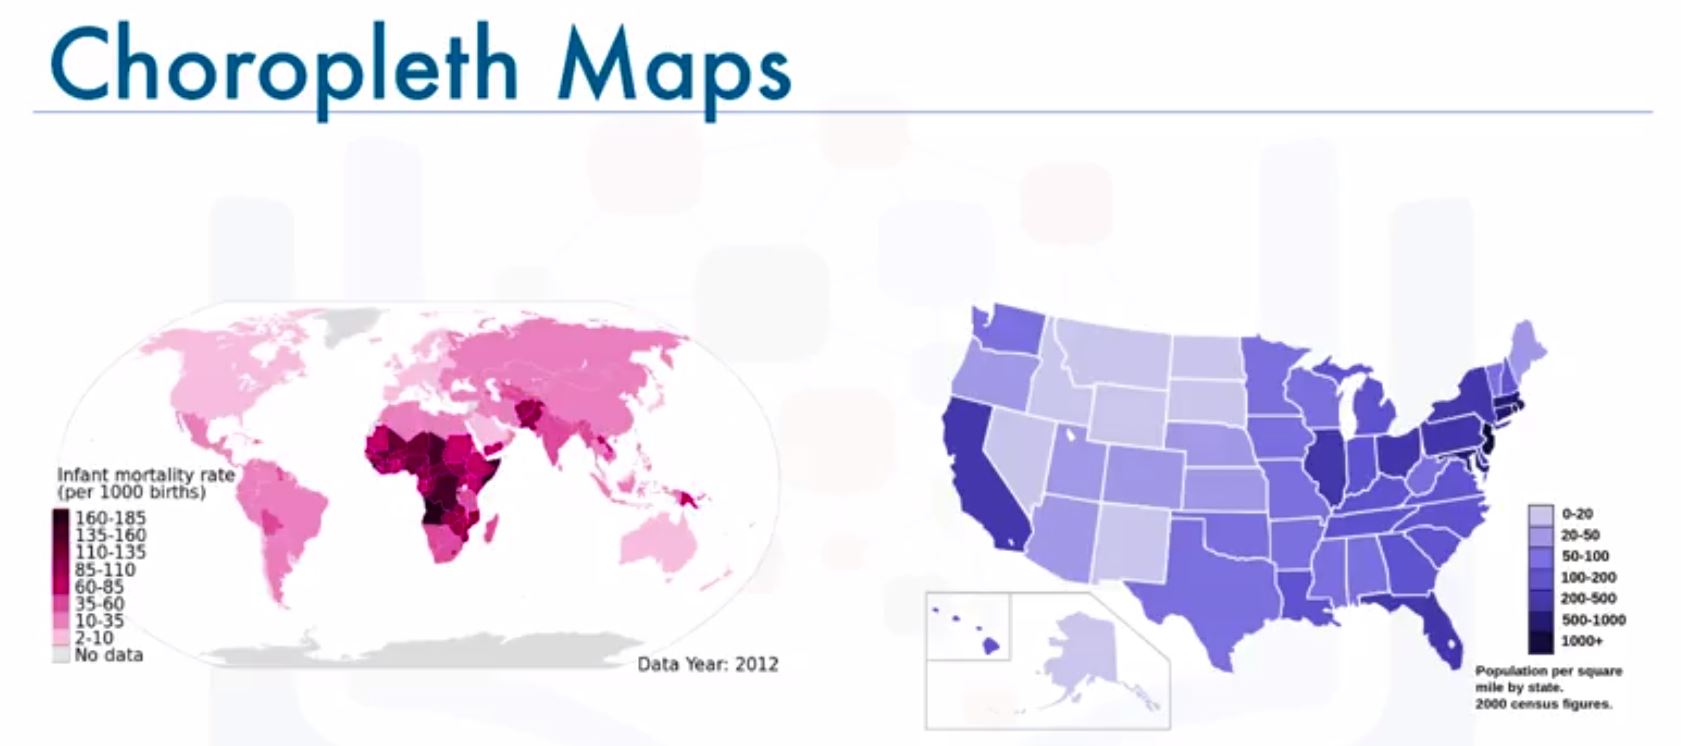
- Choropleth Maps: A choropleth map is a thematic map in which areas are shaded or patterned in proportion to the measurement of the statistical variable being displayed on the map, such as population density or per capita income. The higher the measurement the darker the color.
- Examples of folium map styles.
- stamen toner : great for visualizing and exploring river meanders and coastal zones.
- stamen terrain : great for visualizing hill shading and natural vegetation colors.
- Choropleth Maps: A choropleth map is a thematic map in which areas are shaded or patterned in proportion to the measurement of the statistical variable being displayed on the map, such as population density or per capita income. The higher the measurement the darker the color.
Assignment
- Install folium after installing Anaconda (cf):
conda install -c conda-forge folium